
Media Create, the sales tracking group for video game goods, offers more than just a weekly top ranking of sales. Even though we’ll be entering 2018 soon, those who have access to Media Create’s giant roundup of the year can start picking apart what has sold well.
With that in mind, you’d think that we’d have sales figures for 2017. Well, that’s not quite the case, as the most recent data shared by hisa-kun on Resetera is showing off 2016 statistics instead. What’s nice about this data bundle is that we can see how amiibo fared during 2016 in Japan.
YTD sales / LTD sales
Media Create: Top 10 Amiibo Figure Sales 2016
01. Amiibo Callie {2016.07.07} (¥1.200) – 299.300 / 299.300
02. Amiibo Marie {2016.07.07} (¥1.200) – 298.189 / 298.189
03. Amiibo Squid {2015.05.28} (¥1.200) – 158.990 / 392.757
04. Amiibo Boy {2015.05.28} (¥1.200) – 151.662 / 377.970
05. Amiibo Girl {2015.05.28} (¥1.200) – 147.457 / 382.206
06. Amiibo Squid (Orange) {2016.07.07} (¥1.200) – 101.651 / 101.651
07. Amiibo Girl (Lime Green) {2016.07.07} (¥1.200) – 97.442 / 97.442
08. Amiibo Boy (Purple) {2016.07.07} (¥1.200) – 84.661 / 84.661
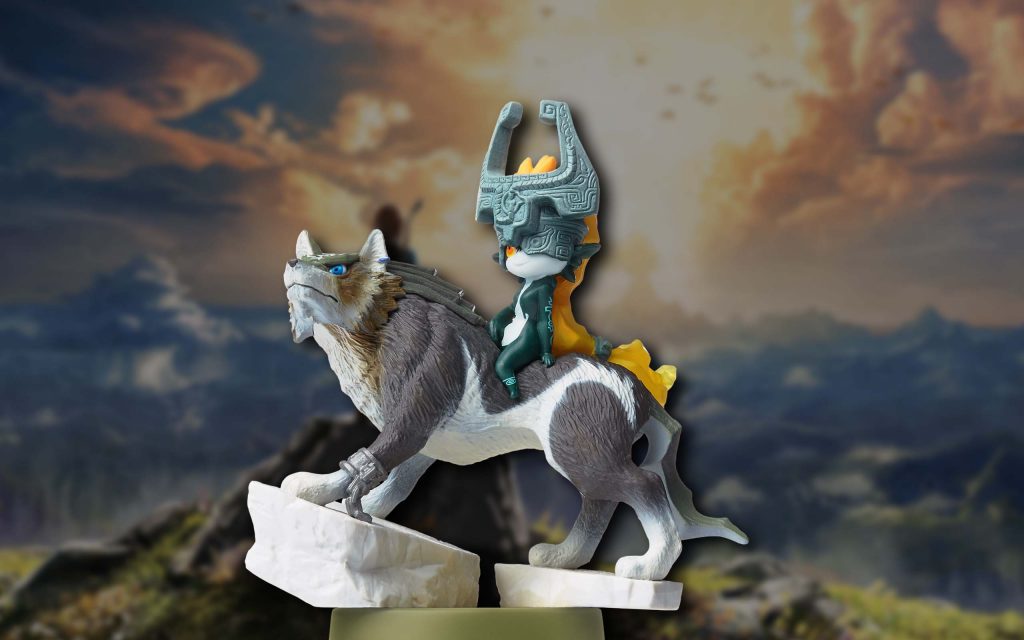
09. Amiibo Wolf Link (Twilight Princess) {2016.03.10} (¥1.500) – 72.199 / 72.199
10. Amiibo Isabelle (Winter Outfit) {2015.11.21} (¥1.200) – 42.333 / 110.093Total Amiibo Figure Sales 2014: 301.075 / 301.075
Total Amiibo Figure Sales 2015: 3.036.448 / 3.337.523
Total Amiibo Figure Sales 2016: 2.483.771 / 5.821.294
While a drop in sales did occur when you compare 2015 and 2016, it isn’t a big one. A difference of 552,677 units, that can be equated to the lack of releases compared to 2015 — and keep in mind that this occurred during the transition period between the Wii U and the Switch.
Regardless, the love for Splatoon is certainly strong in Japan. It also proves that Callie is “the best” by selling 1,111 more units than her “sister,” Marie.
It doesn’t end there! Media Create also collects data for amiibo cards:
Media Create: Top 5 Amiibo Card Sales 2016
01. Animal Crossing Amiibo Card Series 3 {2016.01.14} (¥300) – 415.084 / 415.084
02. Animal Crossing Amiibo Card Series 4 {2016.03.24} (¥300) – 260.445 / 260.445
03. Animal Crossing Amiibo+ Card {2016.11.03} (¥300) – 255.947 / 255.947
04. Animal Crossing Amiibo Card Series 2 {2015.10.29} (¥300) – 251.852 / 821.113
05. Animal Crossing Amiibo Card Series 1 {2015.07.30} (¥300) – 205.113 / 1.666.391Total Amiibo Card Sales 2015: 2.030.538 / 2.030.538
Total Amiibo Card Sales 2016: 1.388.442 / 3.418.980
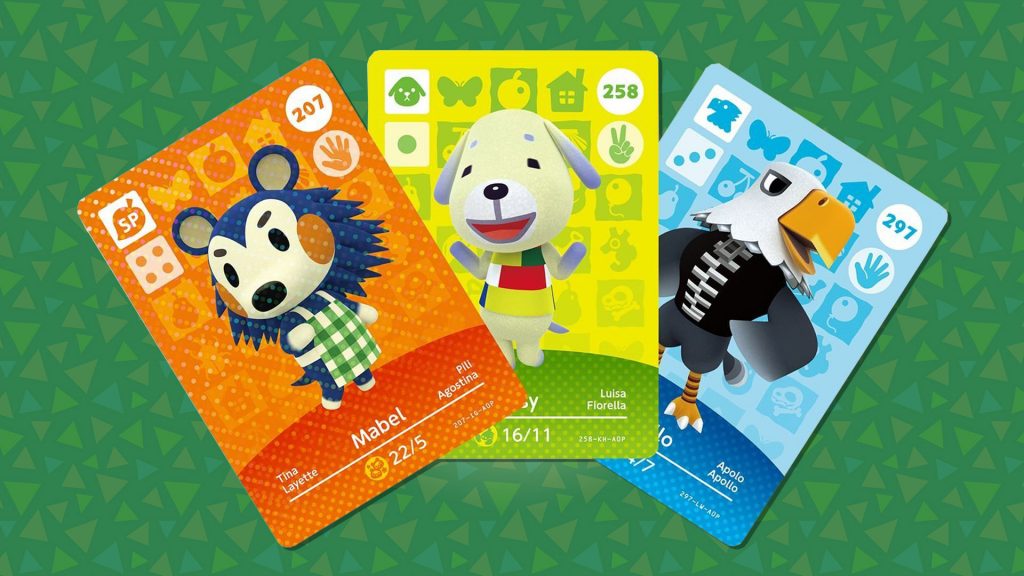
The drop in sales is more significant here — in fact, it’s nearly cut in half. Of course, those who have entered the world of Animal Crossing amiibo cards understand the craziness that comes along with collecting them. At some point you just have to stop buying packs and start trading.
Lastly, an analysis of amiibo sales by series has been provided. After seeing out well the game’s figures performed in the individual amiibo sales category, it should come to no surprise that Splatoon is the best-selling series of 2016. Yet if you wanted to see what else sold well throughout the year, this breakdown will certainly point you in the right direction.
Media Create: Amiibo Figure Sales Share by Series 2016
Splatoon – 1.339.352 (53,92%)
Super Smash Brothers – 500.104 (20,13%)
Animal Crossing – 235.358 (9,48%)
Super Mario – 103.965 (4,19%)
The Legend of Zelda – 98.203 (3,95%)
Kirby – 87.892 (3,54%)
Others – 118.896 (4,79%)
Total: 2.483.771 (100%)
Have any guesses what 2017’s results will be like? We’re looking forward to finding out what those look like! Stay tuned, as we’ll be reporting those numbers once they’re made available.
Written by Jennifer Burch
Illustrator, designer, writer and big Nintendo geek, you can find Jennifer with an N3DS within reach 24/7. As the oldest of three, she has survived many Mario Party, Super Smash Bros. and Mario Kart sessions intact in addition to getting her brothers hooked on some really weird games. (Cubivore anyone?)